Completed UT Austin postgraduate coursework using a supplied scenario, dataset, and starter notebook. The charts below come from my completed notebook.
FoodHub
Python data handling, summary statistics, and visual exploration
pandas, NumPy, Seaborn, Matplotlib
The supplied data
The course provided 1,898 FoodHub orders with nine fields: order and customer IDs, restaurant, cuisine, cost, weekday or weekend, rating, food preparation time, and delivery time. A missing rating was recorded as “Not given,” which needed different handling from a zero rating.
What I did
- Checked types, missing values, and descriptive statistics before comparing restaurants, cuisines, and customers.
- Used counts, histograms, boxplots, and grouped views to examine cost, ratings, preparation, and delivery.
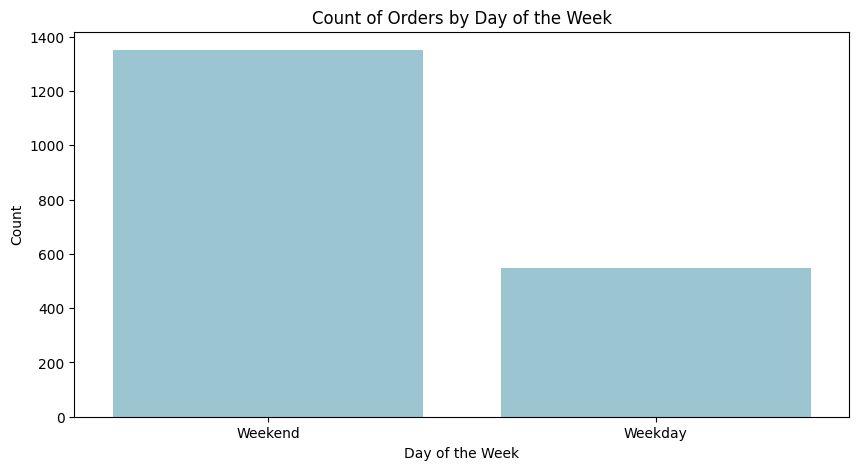
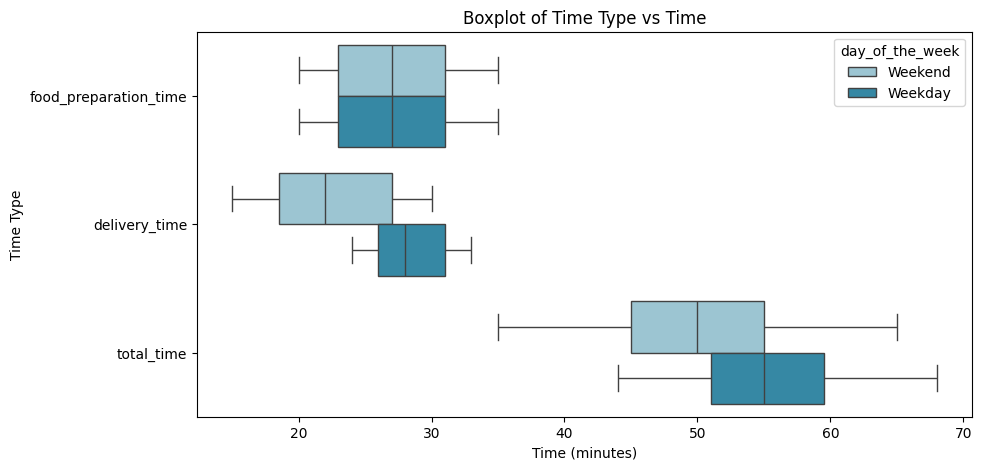
- Compared weekday and weekend patterns and calculated the share of orders taking more than an hour in total.
Finding in the course dataset
American, Japanese, and Italian food had the most orders. Delivery took longer on weekdays in the recorded orders, and 736 of 1,898 orders had no rating. About 10.5% of orders took more than 60 minutes including preparation and delivery.
Learning reinforced
This was a foundations exercise in asking answerable questions of a table, choosing a useful grouping, and treating missing feedback carefully. The notebook explored associations; it did not build a predictive model or establish why delivery was slower.
Original notebook export
View the complete HTML report, including code, outputs, and the original written analysis.