Completed UT Austin postgraduate coursework using a supplied scenario, dataset, and starter notebook. The charts below come from my completed notebook.
ReCell
Regression, feature selection, and model assumptions
pandas, NumPy, statsmodels, scikit-learn, Seaborn, Matplotlib
The supplied data
The course provided 2021 used and refurbished device records. Predictors included brand, operating system, screen size, camera resolution, memory, battery, release year, days used, and normalized new-device price. The response was normalized used-device price; the analysis concerns that transformed price, not a live resale quote.
What I did
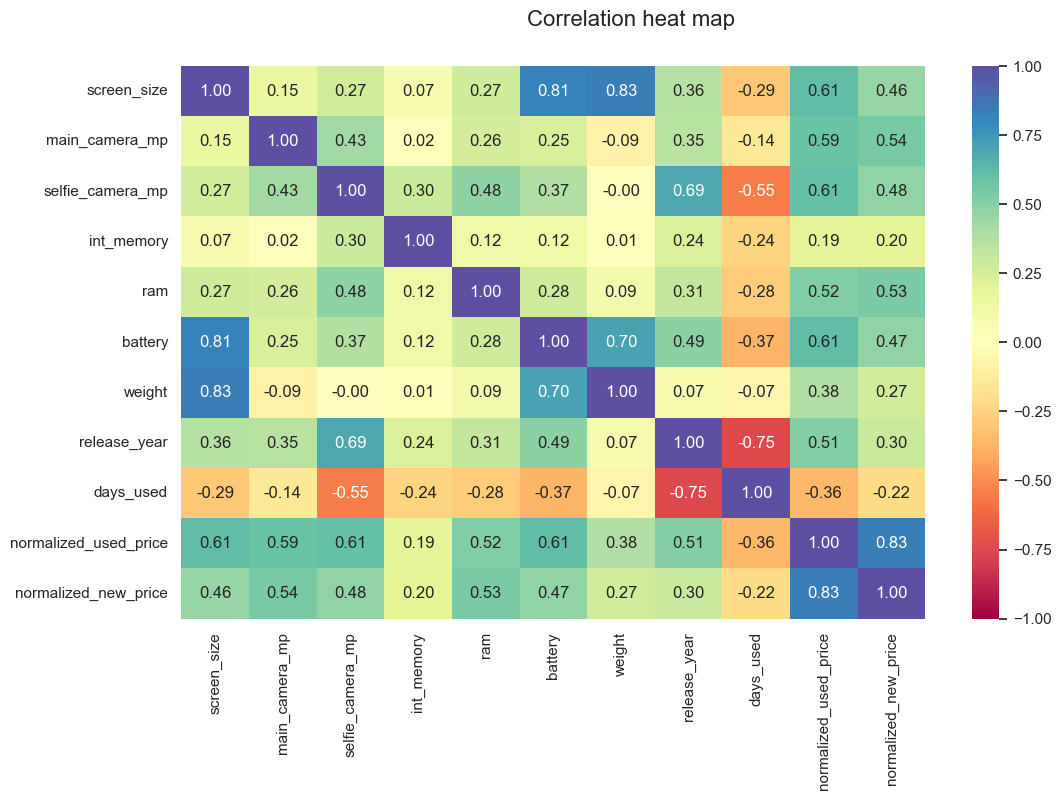
- Explored price distributions, brand and operating-system representation, and relationships among numeric features.
- Built an ordinary least squares regression model, compared train and test errors, and reduced predictors using significance and variance inflation checks.
- Reviewed residual plots and tests for linearity, normality, and constant variance before interpreting the final model.
Finding in the course model
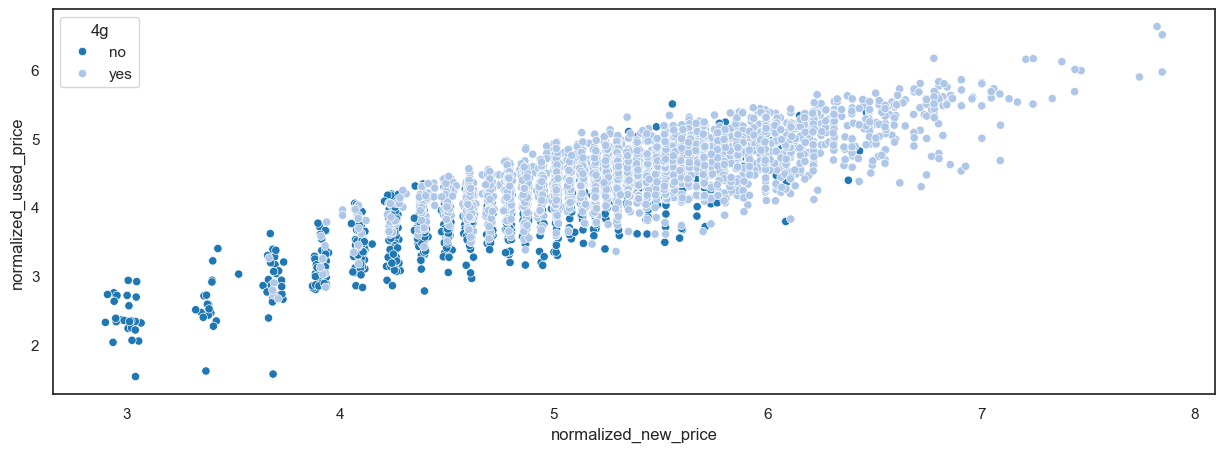
Normalized new-device price was strongly associated with normalized used price. The final model had adjusted R² of about 0.836, with comparable training and test errors in the notebook. Camera resolution, RAM, release year, screen size, and new price remained useful model features.
Learning reinforced
This exercise connected exploratory correlation to a multivariable model, then tested whether the model’s assumptions and held-out errors supported its interpretation. The dataset’s operating-system mix was heavily Android, a limitation when generalizing to other devices.
Original notebook export
View the complete HTML report, including code, outputs, and the original written analysis.