Completed UT Austin postgraduate coursework using a supplied scenario, dataset, and starter notebook. The charts below come from my completed notebook.
Trade & Ahead
Scaling, K-means, hierarchical clustering, and cluster interpretation
pandas, NumPy, scikit-learn, SciPy, Seaborn, Matplotlib
The supplied data
The course supplied 340 company records with ticker, sector, sub-industry, stock price, 13-week price change and volatility, plus financial measures such as return on equity, cash ratio, cash flow, income, earnings per share, shares outstanding, and valuation ratios. There was no “correct cluster” label to predict.
What I did
- Explored skew, outliers, and sector mix, then prepared and scaled the numeric features for distance-based methods.
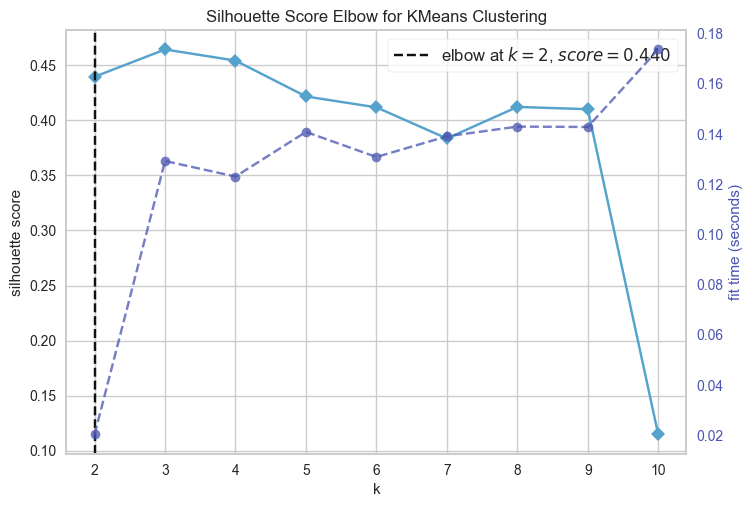
- Compared candidate K-means group counts with elbow, distortion, and silhouette views; also examined hierarchical clustering.
- Profiled the resulting groups by price, price change, volatility, and financial indicators instead of treating a cluster ID as an investment rating.
Finding in the course dataset
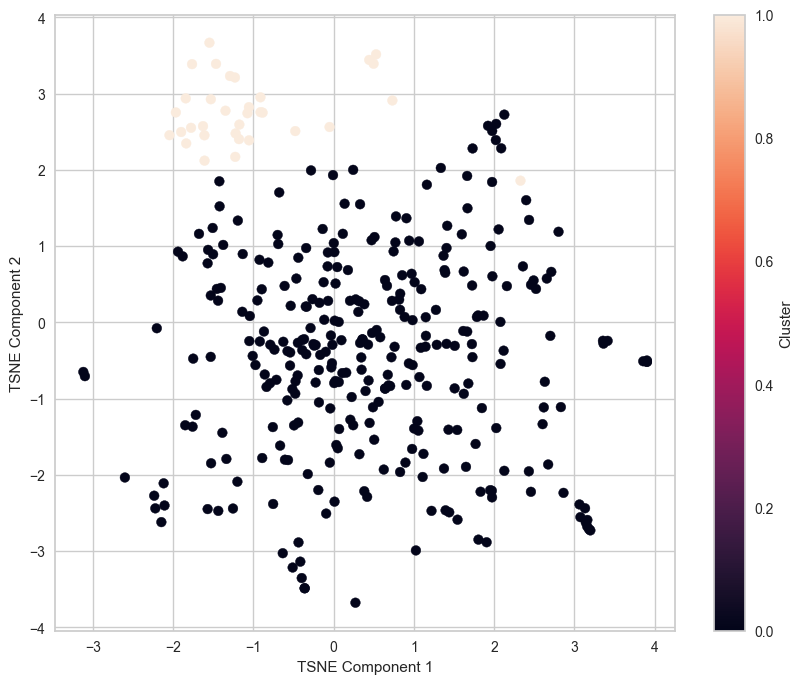
The two-cluster solution grouped 307 stocks together and 33 in a smaller group. The smaller group showed lower average price, negative average 13-week price change, and greater volatility in the notebook’s profile. These are descriptive patterns in the supplied sample, not a forecast.
Learning reinforced
This exercise showed how preprocessing and the choice of cluster count shape an unsupervised result, and why group descriptions require looking back at the original variables. The clusters are an analysis aid, not investment advice or a portfolio recommendation.
Original notebook export
View the complete HTML report, including code, outputs, and the original written analysis.